|
|
|
HOME
ABOUT US
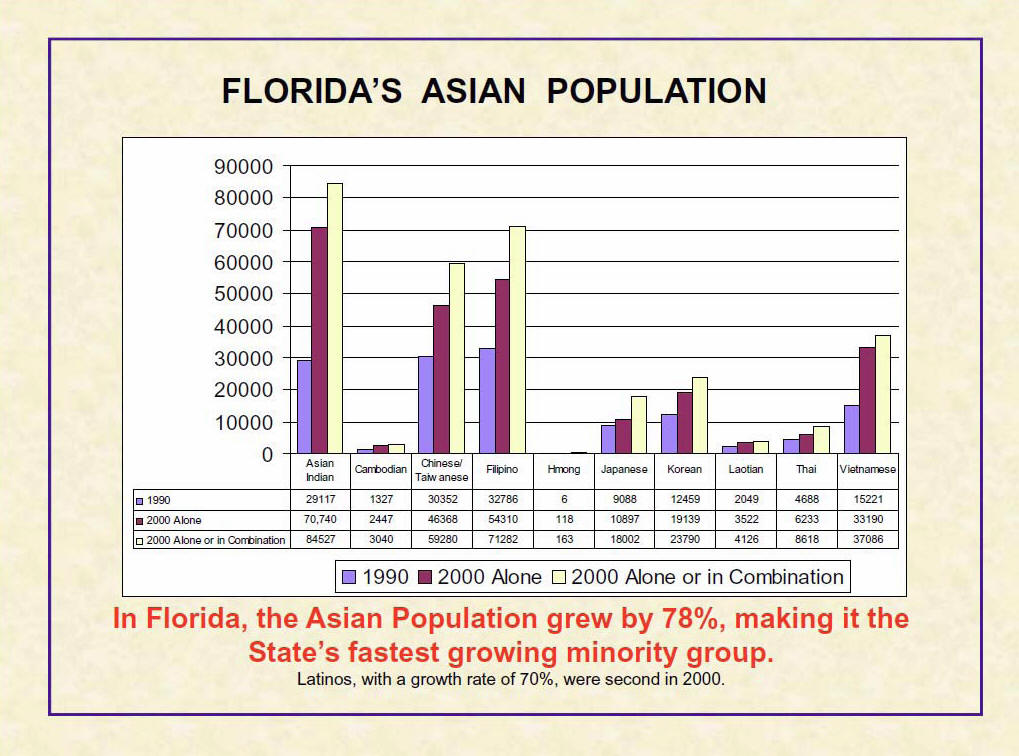
Asian Pacific American Census Facts and Figures
POPULATION TOTAL
|
11.9 million
|
The number of US residents who reported as Asian alone
or in combination with one or more other races in Census
2000. This group made up 4.2 percent of the total
population.
|
|
A total of 2.7 million people reported they were Chinese
alone or in combination with one or more other races or
Asian groups in Census 2000, making Chinese the leading
Asian group; Filipino (2.4 million) and Asian Indian
(1.9 million) followed. (The Chinese population does not
include Taiwanese.)
|
|
874,400
|
The number of US residents who reported as Native
Hawaiian and Other Pacific Islander alone or in
combination with one or more other races in Census 2000.
This group made up 0.3 percent of the total population.
|
INCOME AND POVERTY
|
$55,525
|
The median income in 2000 of Asian and Pacific Islander
households, the highest median income of any racial
group. The 2000 income equaled the all-time high for
Asians and Pacific Islanders.
|
|
10.7%
|
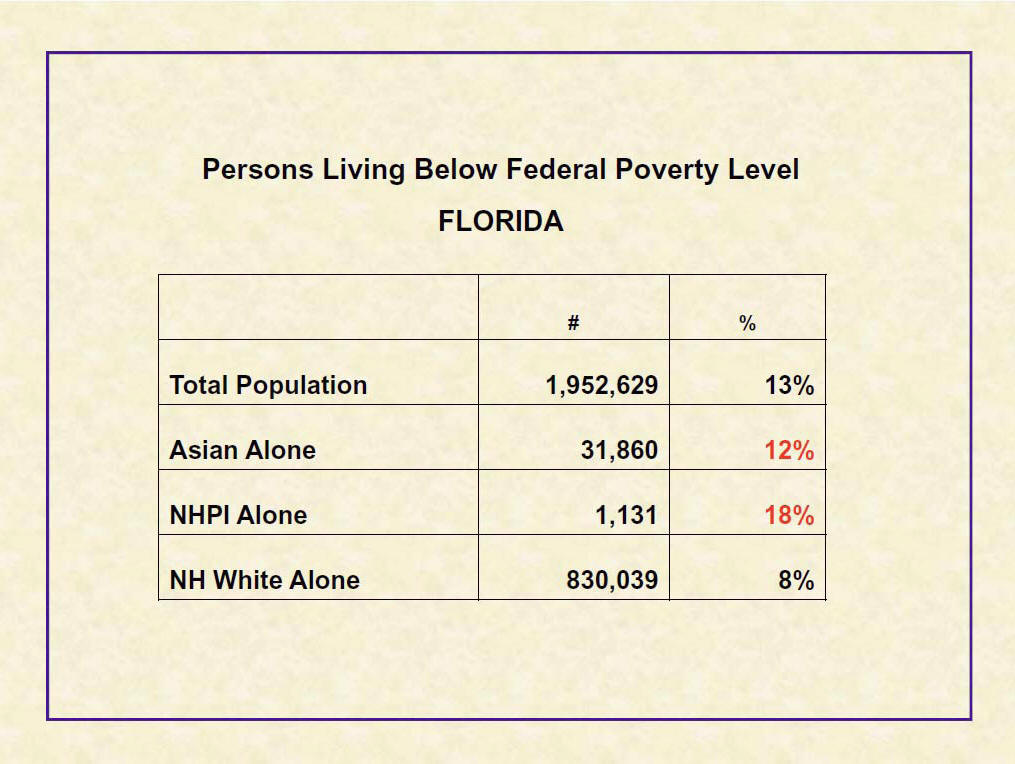
The poverty rate of Asians and Pacific Islanders in 2000
(as compared to an estimated of 10% of all Americans).
The 2000 rate equaled the lowest poverty rate the Census
Bureau has ever measured for this race group.
|
|
The poverty rates among certain APA subgroups: Hmongs
(66%); Cambodians (47%); Laotians (34%); and Vietnamese
(34%).
|
UNINSURED
The cost of health insurance is a major barrier for APAs who are
likely to be self-employed or working for small firms that
typically do not offer employer-sponsored coverage.
|
17%
|
The percentage of uninsured APA children.
|
|
24%
|
The percentage of uninsured APA adults.
|
|
34%
|
The percentage of uninsured recent immigrants and
first/second generation APAs.
|
|
20%
|
The percentage of uninsured APA working families.
|
|
50%
|
The percentage of APAs who may be medically underserved.
|
EDUCATION
|
44%
|
The percentage of Asians and Pacific Islanders age 25
and over with a bachelor's degree or higher in 2000. The
corresponding rate for all adults 25 and over was 26
percent.
|
|
86%
|
The percentage of Asians and Pacific Islanders 25 and
over who were high school graduates in 2000. This
percentage is slightly higher than the 84 percent of all
adults in this age group.
|
|
1 million
|
The number of Asians and Pacific Islanders with an
advanced degree in 2000 (e.g., master's, Ph.D., M.D. or
J.D.), comprising a ratio of 1-in-7 Asians and Pacific
Islanders 25 and over.
|
COMING TO AMERICA
|
7.2 million
|
The number of US residents in 2000 who were born in
Asia. Asian-born residents comprised 26 percent of the
nation's total foreign-born population. The number of
Asian-born people totaled just 800,000 in 1970, then
more than tripled in the 1970s and nearly doubled again
in the 1980s, reaching 5.0 million in 1990.
|
|
In 2000, the five largest contributors to the nation's
Asian- born population were China, India, Korea, the
Philippines and Vietnam. All five were among the 10
leading countries of birth of the foreign-born. As
recently as 1970, no Asian country was on this list.
|
|
Close to half (about 45 percent) of the nation's
Asian-born population lived in three metropolitan areas
in 2000: Los Angeles, New York and San Francisco.
|
|
47%
|
Percentage of the foreign-born population from Asia who
were naturalized US citizens in 2000. Only those born in
Europe had a higher rate (52 percent).
|
|
88%
|
Percentage of Asians and Pacific Islanders in 2000 who
were either foreign-born themselves or had at least one
foreign- born parent.
|
BUSINESSES
|
913,000
|
Number of Asian and Pacific Islander-owned businesses in
the United States in 1997. These businesses employed
more than 2.2 million people and generated $306.9
billion in revenues. They made up 4 percent of the
nation's 20.8 million non-farm businesses and 30 percent
of all minority-owned firms.
|
|
Asian and Pacific Islander-owned firms generated more
than half (52 percent) of all minority-owned business
revenues.
Between 1992 and 1997, the number of businesses owned by
Asians and Pacific Islanders increased about four times
as fast as the total number of businesses (30 percent
versus 7 percent). Receipts of Asian- and Pacific
Islander-owned firms rose 68 percent, compared with a 40
percent increase for all US firms over the period.
(These data exclude C corporations for which prior
comparable data are not available.)
In 1997, more than 1-in-3 Asian and Pacific
Islander-owned firms were located in the following metro
areas: Los Angeles- Long Beach, Calif.; New York, NY;
Orange County, Calif.; Honolulu, Hawaii; and San
Francisco, Calif.
|
|
$336,200
|
Average receipts of Asian and Pacific Islander-owned
firms in 1997. This total is lower than the average for
all firms ($410,600), but higher than that for all
minority-owned firms ($194,600). (The average for all
firms excludes publicly held corporations and firms,
such as mutual companies, whose owners' race or
ethnicity could not be determined.)
|
|
45,000
|
The number of Asian and Pacific Islander-owned firms
with annual sales of $1 million or more each in 1997.
|
POPULATION DISTRIBUTION
|
Nation
|
|
Census 2000 was the first census in which respondents
had the option of choosing more than one race to
describe their racial identity. People who chose Asian
alone in 2000 showed an increase of 3.3 million, or 48
percent, since 1990. However, if the population who
chose Asian and at least one other race is added, the
result is an increase of 5.0 million, or 72 percent. By
comparison, the total US population grew by 13 percent.
Similarly, the population who chose Pacific Islander
alone in 2000 showed an increase of 34,000, or 9.3
percent, over 1990. However, if the population who chose
Pacific Islander and at least one other race is added,
the result is an increase of 509,000, or 140 percent.
(Note: The data that follow pertain to the population
who reported as Asian alone, as well as those who
reported Asian and at least one other race.)
|
|
49%
|
The proportion of people reporting as Asian in Census
2000 who lived in the Western part of the United States.
|
|
States
|
|
80%
|
The percentage of APAs reside in 10 states: California,
New York, Hawaii, Texas, New Jersey, Illinois,
Washington, Florida, Virginia and Massachusetts.
|
|
4.2 million
|
The number of California residents who reported as Asian
in Census 2000, making the Golden State the state with
the highest number of Asians. New York, Hawaii, Texas,
New Jersey, Illinois, Washington, Florida, Virginia and
Massachusetts followed in order. Combined, these ten
states represented 75 percent of the country's Asian
population.
|
|
58%
|
The percentage of Hawaii's population who reported as
Asian in Census 2000, tops in the nation. California (12
percent) followed.
|
|
Places
|
|
45%
|
The percentage of APAs in 3 metropolitan areas: Los
Angeles, New York and San Francisco.
|
|
872,780
|
The number of people in New York City who in Census 2000
reported as Asian. New York led all the nation's places
in number of Asians. Los Angeles was second, with
407,440, followed by San Jose, San Francisco and
Honolulu (each with slightly more than 250,000).
|
|
68%
|
Percentage of Honolulu residents who in Census 2000
reported as Asian. Among places with 100,000 or more
residents, the only other that had more than one-half of
its population reporting as Asian was Daly City, Calif.
(54 percent). All of the remaining cities among the 10
with the highest percentage of Asians in their
population were in California: Fremont, Sunnyvale, San
Francisco, Irvine, Garden Grove, Santa Clara, Torrance
and San Jose.
|
AGE DISTRIBUTION
|
31.1
|
The median age of the Asian population in 2000, meaning
one- half were above this midpoint and one-half below.
The median age for the entire US population was 35.3.
|
COMPUTER ACCESS
|
66%
|
The proportion of the nation's Asian and Pacific
Islander adults 18 and over who, as of 2000, lived in a
household with a computer. Asians and Pacific Islanders
18 and over had the highest rate of home computer access
of any race or ethnic group. In addition, 44 percent of
Asian and Pacific Islander adults used the Internet at
home.
|
FAMILIES
|
2.5 million
|
The number of Asian and Pacific Islander families in
2000. Of these, 80 percent were maintained by married
couples, 13 percent by women with no spouse present and
7 percent by men with no spouse present.
|
|
Asian and Pacific Islander families tended to be
relatively large. In 2000, for example, 23 percent of
Asian and Pacific Islander married-couple families had
five or more members.
|
LIMITED ENGLISH PROFICIENT & LINGUISTICALLY ISOLATED GROUPS
|
Cultural and linguistic barriers significantly affect
APA access to health care and information.
|
|
6.9 million
|
The number of people who in 2000 spoke an Asian or
Pacific Islander language at home.
|
|
Percentage of APAs who do not speak English “well” (or
at all)
Hmong (76%)
Cambodian (70%)
Laotian (68%)
Vietnamese (61%)
Taiwanese (54%)
Korean (52%)
Chinese, except Taiwanese (50%)
Thai (46%)
Indonesian (40%)
Togan (39%)
Pakistani (30%)
Japanese (25%)
Filipino (24%)
Asian Indian (24%)
Samoan (22%)
Guamanian (16%)
Hawaiian (3%)
|
Percentage of APAs who are linguistically isolated
Hmong (60%)
Cambodian (55%)
Laotian (52%)
Vietnamese (42%)
Taiwanese (37%)
Korean (35%)
Chinese, except Taiwanese (34%)
Thai (27%)
Indonesian (26%)
Togan (19%)
Pakistani (15%)
Japanese (14%)
Filipino (11%)
Asian Indian (10%)
Samoan (8%)
Guamanian (7%)
Hawaiian (1%)
|
VOTING
While the rate at which Asian and Pacific Islander citizens
voted (43 percent) remained unchanged between the 1996 and 2000
elections, the number of these voters increased by about 20
percent. This reflected growth in the voting-age population and
citizenship of Asian and Pacific Islanders.
Source: US Census 1999; US Census 2000; Current Population
Survey; Survey of Minority-Owned Business Enterprises; Census
2000 Supplementary Survey; Families USA (2001).
|
|
STATE POPULATION
The Census Bureau estimated that in July 2007
Florida’s population had increased by an annual average of about 310,740
residents since 2000 (to 18,251,243 residents). Over that period, net
immigration was adding about 92,365 persons each year (more immigrants arriving
than leaving). During the same period there was an annual average population
gain of about 176,190 residents from net domestic migration (more native-born
residents arriving than leaving). Net immigrant settlement accounted directly
for nearly three-tenths (29.7%) of the population increase over this period, and
that does not include the children born to the immigrants after their arrival in
the United States.
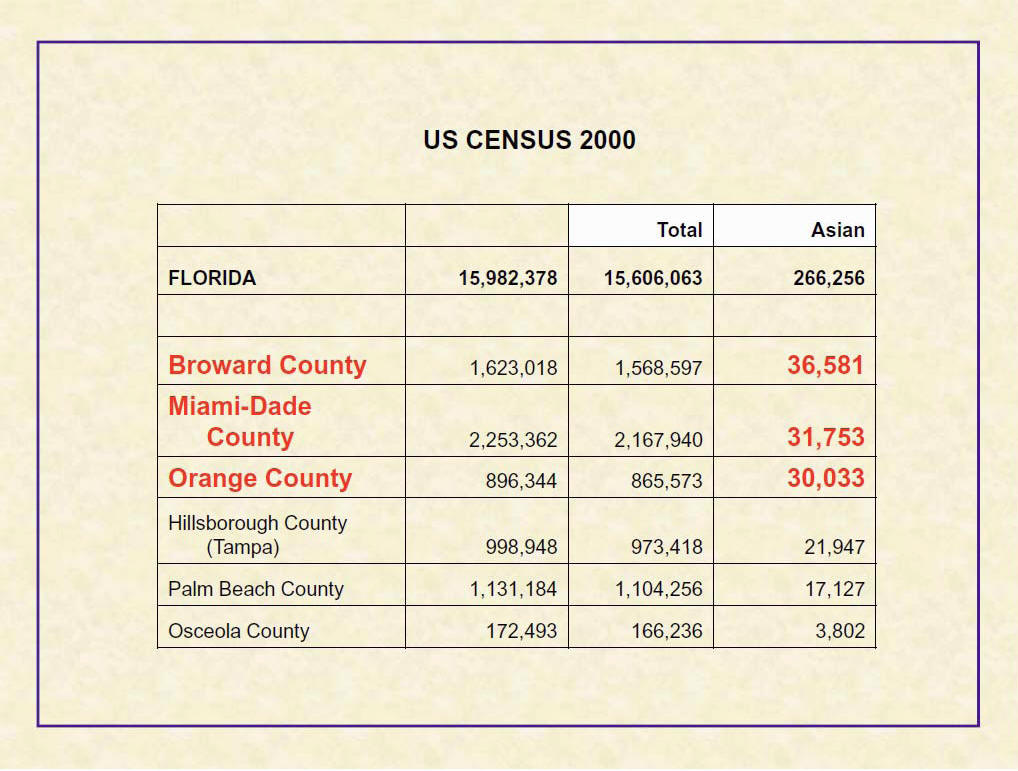
The 2000 Census found 15,982,378 persons resident in Florida. This was an
increase of 3,044,452 persons (23.5%) above the 1990 Census. The amount of
increase was the third highest in the country. The rate of increase was the
seventh highest in the country.
The Census finding represented about 750 thousand more persons than the Census
Bureau had expected to find in the state in 2000 when it last issued state
population projections in 1966. The significance of this is that the Census
Bureau has concluded that much of the shortfall in their population estimates
during the 1990s was due to an underestimation of the illegal alien population.
Florida had the 3rd greatest population increase in the country between
1960-2000.
Over the 1980-90 decade, the state's population increased by 32.7 percent (from
9,746,961 to 12,937,926 residents).
FOREIGN-BORN POPULATION
FAIR
estimates that the foreign-born population of Florida was about 3,545,445
residents in July 2007. This meant a foreign-born population share of 19.4
percent. The amount of change since the 2000 Census indicates an average annual
rate of increase in the foreign-born population of about 119,810 people, which
is nearly one-fourth (38.5%) of the state’s annual average population increase.
Since 2000, the foreign-born population has increased by 32.7 percent compared
to a 10.5 percent increase in the native-born population.
Immigration also contributes to population growth through the children born to
immigrants in this country. Nationally the share of births to the foreign-born
is about double their share of the population. A 38.8 percent share of the
state’s current births is large enough to account for about 84,035 births a
year. Combining the increase in the foreign-born population and estimated
immigrant births suggests that immigration may account for adding about 201,000
persons to the state’s population annually, i.e., nearly two-thirds (65.6%) of
the state’s overall population increase.
The 2000 Census recorded 2,670,828 foreign-born residents in the state. That was
16.7 percent of the state's overall population and an increase of 60.6 percent
above the 1990 foreign-born population of 1,662,601 residents. The amount of
increase was the fourth highest in the country. However, the rate of increase in
the foreign-born population was not among the 25 highest in the country.
That increase in the immigrant population by about three-fifths was much higher
than the 18.1 percent increase in the native-born population.
A comparison of the increase in the immigrant population from 1990 with the
change in the overall population during the same period shows that immigrant
settlement directly accounted for about one-third (33.1%) of the state's overall
population increase over that decade. The effect of immigration on population
change is still greater when the children of the immigrants born here after
their arrival are included with their immigrant parents in the calculation. The
amount of the overall impact of immigration (immigrants plus their children) on
population change is more likely to account for about 47 percent of the state's
population increase, based on the increase in the share of those in Florida who
speak a language other than English at home.
The 2000 Census found that 38.6 percent of Florida's foreign-born population had
arrived in the state since 1990. This demonstrates the effects of the current
mass immigration, although it is a lower share than the national average
(43.7%).
An indicator of the change in the immigrant population may be seen in data on
the share of the population that speaks a language other than English at home.
Between 1990 and 2000 the share of non-English speakers at home (over age 5) in
Florida increased by more than one-quarter, from 17.3 percent to 23.1 percent.
Less than half (44.8%) of those who said they spoke a language other than
English at home in 2000 also said they spoke English less than very well.
|
Speakers of Foreign Languages
(at home in Florida in the 2000 Census)
|
|
Spanish
|
2,476,500
|
|
French Creole
|
208,485
|
|
French
|
125,445
|
|
German
|
89,575
|
|
Italian
|
67,255
|
|
Portuguese
|
54,710
|
|
Tagalog
|
38,440
|
|
Arabic
|
32,420
|
|
Vietnamese
|
30,960
|
|
Chinese
|
28,855
|
|
(Source: Census Bureau report: Language Spoken at Home for the
Population 5 Years and Over, April 2004)
|
The Census Bureau’s American Community Survey found that in 2006, the foreign
born population was 3,425,634 residents, an increase of 28.3% percent since
2000. In comparison, the foreign-born population changed from 1,662,601 to
2,670,828 residents between 1990 and 2000, an increase of 60.6 percent.
The ten countries above constituted 52.7% of the foreign-born population in
Florida in 2006. Cuba accounted for approximately one fifth alone (20.5%)
|
Foreign-Born Change: Top Ten Countries 1990-2006
|
|
Rank
|
Country
|
1990
|
|
Country
|
2000
|
|
Country
|
2006
|
|
1
|
Cuba
|
497,619
|
|
Cuba
|
642,951
|
|
Cuba
|
703,108
|
|
2
|
Haiti
|
83,249
|
|
Mexico
|
189,119
|
|
Mexico
|
303,345
|
|
3
|
Canada
|
77,559
|
|
Haiti
|
182,224
|
|
Columbia
|
204,347
|
|
4
|
Jamaica
|
74,863
|
|
Jamaica
|
141,182
|
|
Jamaica
|
186,178
|
|
5
|
Nicaragua
|
72,060
|
|
.Canada
|
99,139
|
|
Canada
|
114,914
|
|
6
|
Colombia
|
66,614
|
|
Nicaragua
|
98,022
|
|
Brazil
|
71,432
|
|
7
|
United Kingdom
|
61,069
|
|
United Kingdom
|
70,384
|
|
Philippines
|
60,022
|
|
8
|
Germany
|
55,321
|
|
Dominican Republic
|
66,690
|
|
India
|
58,090
|
|
9
|
Mexico
|
55,316
|
|
Germany
|
64,088
|
|
Germany
|
57,089
|
|
10
|
Italy
|
28,693
|
|
Peru
|
53,939
|
|
England
|
48,240
|
|
All Other
|
590,232
|
|
All Others
|
1,063,090
|
|
All Others
|
3,425,634
|
|
Total
|
1,662,601
|
|
Total
|
2,670,828
|
|
Total
|
1,806,765
|
Between the 2000 Census and the Census Bureau estimate for 2006, the
foreign-born population in Florida increased by nearly 755,000 persons (28.3%).
Latin America (including Mexico) accounted for an increase of more than 580,500
immigrants (29.9%). Mexico alone accounted for an increase of more than 114,200
additional immigrants (up 60.4%). That was greater than the 60,000 increase in
Cuban immigrants.
Immigrants from Asia grew by 42.6% (nearly 101,000 people). Immigrants
from Africa rose by 71.5% (by nearly 24,700). The immigrant population from
Europe and Canada increased by nearly 49,000 persons (10.7%).
THE IMMIGRANT STOCK
The Census Bureau estimated that there were about 4,637,000 people in Florida in
2000 who were "immigrant stock." That is a term that refers to immigrants and
their children born here after their arrival. Based on that estimate and the
2000 population, the immigrant stock share of the state's population was about
29.0 percent -- the 4th largest share in the country.
As the graph below shows, the amount and share of Florida’s population change
due to the increase in the foreign stock is rising rapidly. Over the past 34
years the new immigrants and children born to them have added about 3,895,000
people to the population. Over this period, the increase in the foreign stock
has accounted for 36.9 percent of the state’s population increase.
NATURALIZATION
Data from the 2006 American Community Survey indicate that 1,549,785 residents,
or 45.2 percent, of the foreign-born population in Florida were citizens,
compared to 1,207,502 residents, or 45.2 percent, in 2000.
Nationally, 40.3 percent of the foreign-born population was citizens in 2000,
and 42.0 percent in 2006.
Population Projection
Florida -- Projected Population in 2050: Projection
Scenarios
|
Amnesty+
|
High-trend
|
Low-trend
|
Zero-net
|
|
33,455,308
|
31,498,757
|
30,164,814
|
24,068,298
|
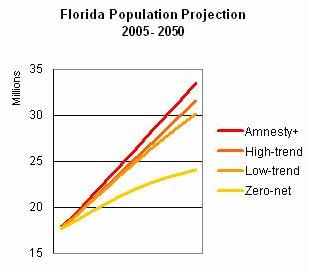
Florida's projected population in 2050 could range anywhere from about 24
million residents to over 33 million. The more than 9 million resident
difference between these extremes depends on whether policies aimed at
immigration stability are adopted or, instead, currently advocated policies that
would accommodate today's illegal alien population, allow a new stream of guest
workers and increase legal immigration are adopted.
Without any change in immigration policy or enforcement, i.e., with the current
trend in large-scale legal and illegal immigration, the state's population is
likely to increase from today's more than 17 million residents to around 30 to
31.5 million persons in 2050 - an increase of 69 to 76 percent.
The largest difference from the current trend comes in comparison with a
zero-net immigration scenario (when arriving immigrants balance those who are
departing). In that case, the population would still grow, but more modestly by
about 36 percent. However, if the currently proposed immigration expansion and
illegal alien accommodation proposals were adopted - the amnesty/guest
worker/immigration increase scenario - the increase in the projected population
over the next 45 years would be more than 87 percent.
Florida -- Projected Population in 2050: Cohorts
|
1970 Pop.
|
Post-'70 Stock
|
Legal Post-'04
|
Illegal Post-'04
|
Amnesty+
|
|
16,902,028
|
7,166,269
|
5,568,406
|
1,862,053
|
1,956,552
|
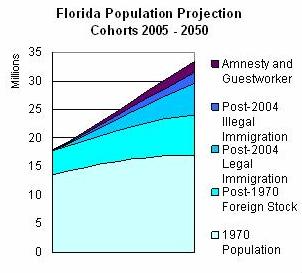
The projection indicates that the population that was already in the country in
1970 - before the effects of the 1965 major change in immigration law - will be
still increasing, by about 2.8 million persons (34%) before leveling off in
about 2040. This trend reflects some net in-migration from other states as well
as larger than average family size among the state's pre-1970 immigrant
population.
Post-1970 immigrants are projected to have a rate of increase (88%) more than
double the rate for the pre-1970 population. The high rate of growth is
influenced by the larger average family size of these immigrants to the state.
At the beginning of the projection, this post-1970 immigrant cohort already
accounted for about 895,000 of the state's residents. By 2050, this cohort is
projected to rise to 1.685 million residents simply on the basis of succeeding
generations being larger than that of their forebears.
Without any change in the immigration laws, current mass immigration will
continue into the state. Florida has had an average of more than 74,600 legal
immigrant admissions per year between 1994 and 2003. The largest national group
has been from Cuba (22.7%). They with immigrants from other majority Hispanic
countries constitute more than half (57.5%) of this immigrant flow. Immigrants
from countries with black populations in Africa, the Caribbean and Latin America
have contributed about 22 percent of immigrant admissions. Immigrants from Asian
countries and from countries with predominantly white populations have each
contributed more than 10 percent of the flow. We project that new immigrants and
their children from all sources will add more than 1.1 million residents to the
state's population over the next 45 years if current trends remain unchanged.
Illegal immigration, like legal immigration to Florida, comes heavily from the
Caribbean and Central America, but also increasingly from Mexico.
We estimate that
Florida's illegal alien population now numbers about 550,000 persons. The
continued addition of illegal immigrants over the next 45 years, assuming it
continues at current rates, is projected to add more than 1.5 million persons to
the population from newcomers and their offspring.
Finally, we project that proposals for amnesty and other provision that are
currently being advocated, if adopted, would add a further nearly 1.6 million
persons to the state's population over the next 45 years. This would result from
the family members of amnesty recipients, increased legal immigration, and
increased long-term guest worker residents.
Florida -- Projected
Population in 2050: Demographic Change
|
White, not Hispanic
|
Mexican
|
Other Hispanic
|
Black
|
Asian
|
Other
|
|
13,853,101
|
2,725,039
|
8,913,066
|
5,668,622
|
1,808,334
|
487,147
|
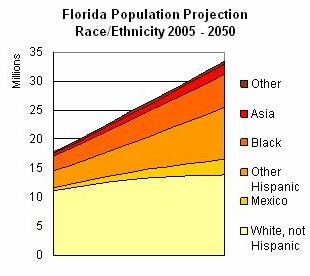
The rate of population change for the various scenarios depends on the size and
demographic composition of the influx of immigrants, and the differential rates
of fertility. The following projections are based on the highest scenario, i.e.,
amnesty/guestworker increases.
Non-Hispanic whites over the period of this projection increase slowly by nearly
1.5 million persons, or 26 percent. This trend is influenced in part by net
migration from other states.
Because the Hispanic population constitutes a large share of the post-70 and
continuing immigrant influx as well as potential amnesty beneficiaries, and this
population on average has larger than replacement family size, the Hispanic
population is projected to rise rapidly: rising by about 3.6 million (476%).
The Asian population is also projected rise sharply, by about 307 percent. That
increase is due to the projected addition of more than 760,000 individuals.
Blacks are projected to increase by a more moderate 70 percent as a result of
adding about 1.8 million residents.
Revised July 2008
